
Consumers are making more and more purchases online via their smartphones
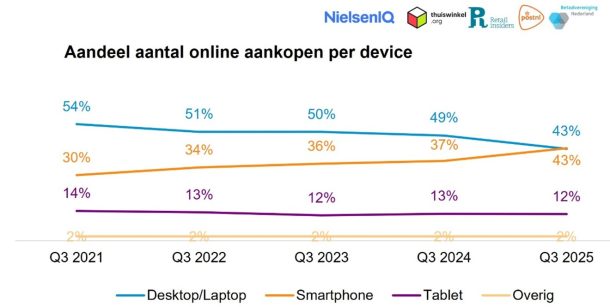
Press release Source : Betaalvereniging & Thuiswinkel.orgDutch consumers spent €7.7 billion online in the third quarter of 2025, 2% less than in the same period last year. The number of online purchases rose by 3% to 86 million. The share of purchases made via smartphone rose to 43%. This means that the share is now equal to that of laptops and desktops. This is evident from the latest figures from the Thuiswinkel Markt Monitor, the survey of online consumer spending in the Netherlands. This survey is conducted by NielsenIQ (NIQ) on behalf of Thuiswinkel.org and Retail Insiders and in collaboration with PostNL and Betaalvereniging Nederland.
Smartphone use for online shopping as high as desktop/laptop
Both smartphones and desktops/laptops are used in 43% of purchases. Other purchases are made via tablet or other devices such as the television. Smartphone use for online purchases has grown significantly in recent years, especially among frequent online shoppers.
The use of smartphones for online purchases shows a clear increase, especially in Food/Nearfood (from 42% to 53%) and Home & Living (from 28% to 43%). In Food/Nearfood and Clothing (from 47% to 53%), the smartphone is now the most important device for online shopping.
Thuiswinkel.org says: ‘We know from previous research that smartphones have already overtaken laptops in terms of internet usage . The fact that online shopping on smartphones now also seems to be becoming more popular than on laptops comes as no surprise to us. Many people are noticing that online shops are becoming increasingly user-friendly on smartphones. It is important that online shops are aware of this change and adapt their shops accordingly.’
Decline in spending mainly on services, large differences between product categories
Online spending on services fell by 6% to €2.7 billion, mainly due to a decline in spending on Tickets for Attractions & Events and Package Holidays. For both categories, the average amount spent per purchase also fell sharply (Package Holidays -11%, Tickets for Attractions and Events -5%). The number of purchases within services also decreased by 9% to 12.3 million. Online spending on products increased to €5 billion (+1%), and the number of purchases rose to 73.3 million (+5%). Noteworthy is the strong growth in the Toys sector, where both online spending (+32%) and the number of purchases (+16%) increased. The average amount spent per purchase rose by 13% in this sector.
Cross-border shopping continues to grow
The number of online purchases from foreign webshops grew by 9% to 11.8 million. This increase is due to more product purchases across the border (+13%). The number of purchases of services from foreign providers, on the other hand, decreased by 7%. China is strengthening its position: its share of the total number of cross-border purchases rose from 27% to 31% in the third quarter. This is mainly due to more purchases in the DIY/Garden, Home & Living and Toys categories. The United States, on the other hand, lost 2 percentage points in its share of online cross-border purchases.
iDEAL remains stable, credit card use declines slightly
The share of iDEAL remains unchanged at 71%. Credit card use declined slightly, from 10% to 8%. This decline is particularly noticeable in the Food/Nearfood, DIY/Garden, Home & Living and Individual Flight Tickets and Accommodations sectors.
Meer lezen over de ontwikkelingen in de e-commerce of dieper de data in? Leden van Betaalvereniging Nederland krijgen het rapport en toegang tot het dashboard via hun infonet-account. Ga hiervoor naar Inloggen – InfoNet (betaalvereniging.nl). Het rapport is te downloaden via de pagina ‘Uitleg dashboard’. Let op: voor toegang tot dit dashboard is inloggen met een Infonet-account en bijbehorend wachtwoord vereist.